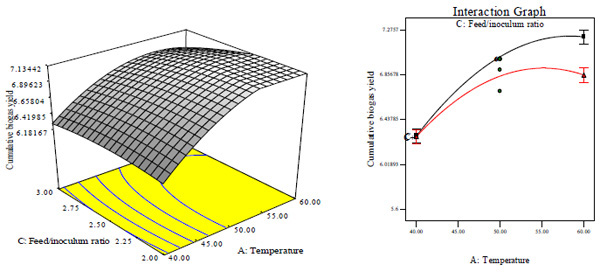
Fig. (4A)
Three dimensional surface plot and Fig. (
4B
) interaction plot that shows the effect of interaction between temperature and feed/inoculums ratio on cumulative biogas yield.