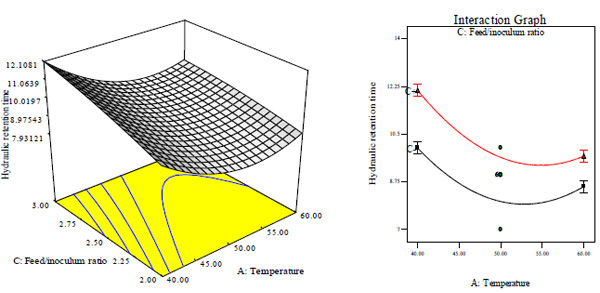
Fig. (4E)
Three dimensional surface plot and Fig. (
4F
) interaction plot that shows the effect of interaction between temperature and feed/inoculums ratio on hydraulic retention time.