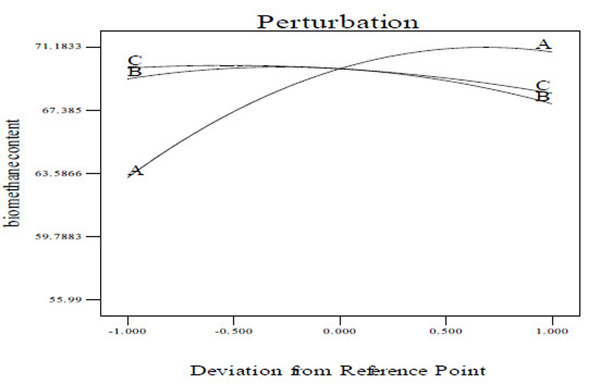
Fig. (6B)
Perturbation plot representing the effect of individual variables on BC.