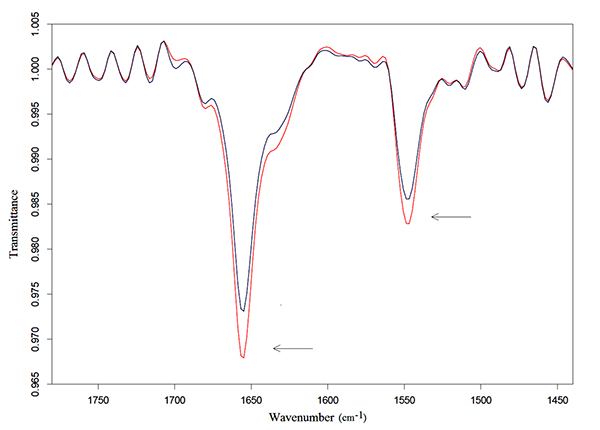
Fig. (3) FSD representative spectra of Amide I and Amide II regions of hemoglobin in bidistilled water solution after 3 h of exposure to 1750 MHz mobile phone MWs at the power density of 950 mW/m2 (red line refers to exposed sample). FSD analysis evidenced that both Amide I and Amide II vibration bands (indicated by arrows) increased significantly after exposure of Hemoglobin in bidistilled water solution (p<0.05).