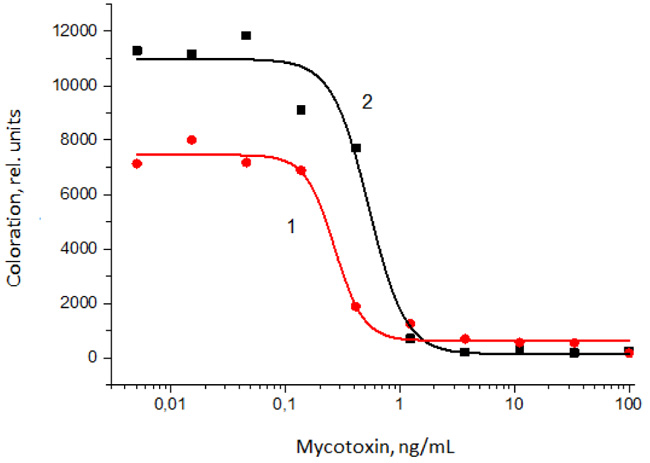
Fig. (5)
Dependences of coloration intensity from the concentrations of AFB1 (curve 1) and T2T (curve 2) for stepwise ICA with indirect labeling. The presented colorations accord to mean values for n = 3; standard errors vary in the range from 8 to 15%.