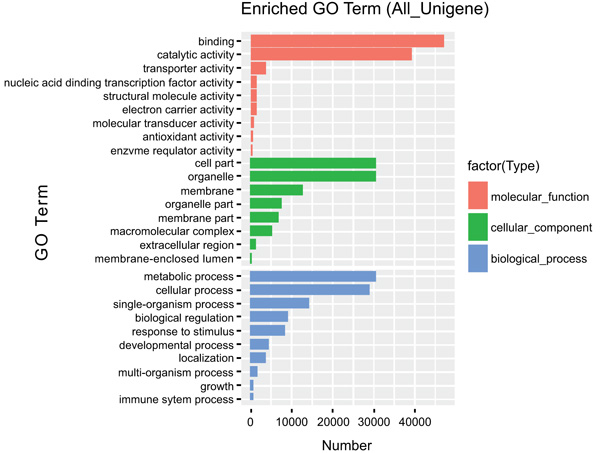
Fig. (3) Gene ontology classification, the vertical axis is the enriched GO terms and the horizontal axis is the number of differential expressed genes in each term. Different colors are used to distinguish between biological processes, cellular components, and molecular functions.