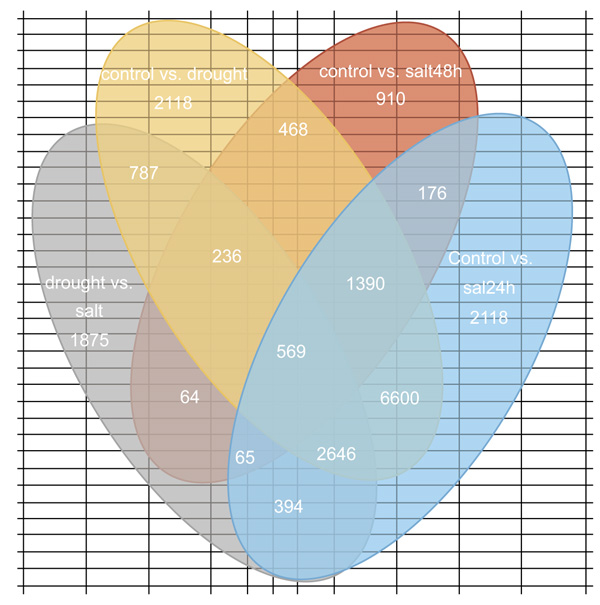
Fig. (6) Venn diagrams showing the number of unique DEGs in each pair of samples, as well as the number of shared DEGs. Treatment groups stand for N1-3 vs. P1-3(drought vs. salt), W1-3 vs. P1-3(control vs. drought), W4-6 vs. N4-6 (control vs. salt 48 h) and W1-3 vs. N1-3(Control vs. salt 24 h).