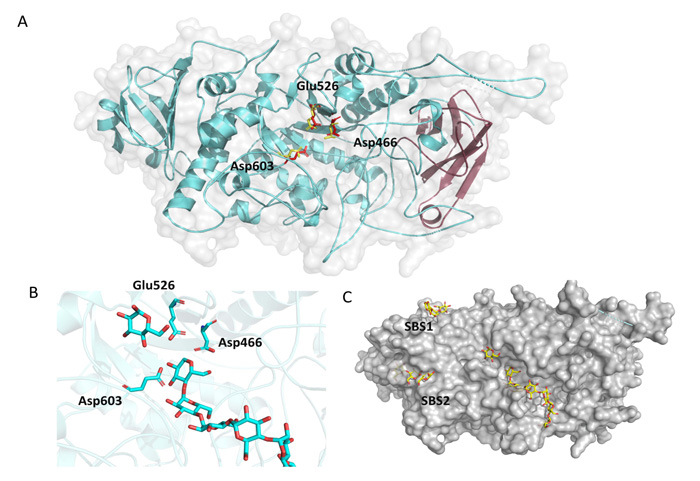
Fig. (3)
Homology modeling of OsttaISA1. A) 3D structure of OsttaISA1 with the CBM domain represented in magenta and the rest of the polypeptide in cyan. Red residues corresponds to the catalytic core of OsttaISA1, and yellow residues represents the core from Isoamylase 1 from Chlamydomonas reindhartii. Numbering refers to OsttaISA1. B) Close-up of the catalytic domain with glucose residues represented. C) Surface of OsttaISA1 showing catalytic cleft and SBS1 and SBS2.