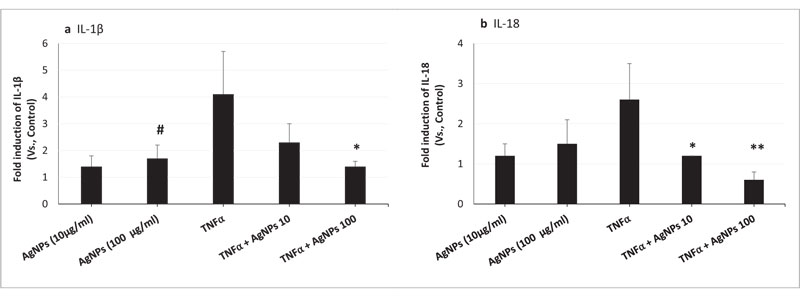
Fig. (1) Suppression of TNFα-induced a) Il-1β and b) Il-18 mRNA expression levels by AgNPs in NCI-H292 cells. Cells were exposed to 20 ng/ml of TNFα and 10 and 100 µg/ml of AgNPs separately and together for 8 h. mRNAs expressions were analyzed using real-time (RT) PCR. Control, which absence of both TNFα and AgNPs shows 1.0. The results are figured as means ± SD, n ≥ 3, for each group; *, 0.01 < P < 0.05, representing a significant difference compared to the corresponding TNFα-exposed group. #, 0.01 < P < 0.05, ##, P < 0.01representing significant differences compared to the control group.