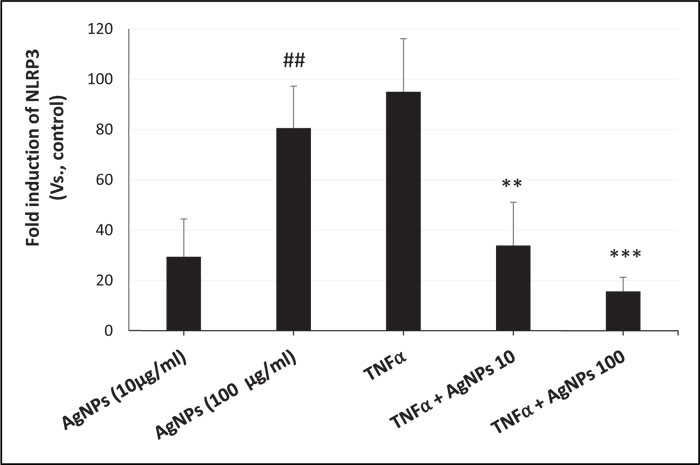
Fig. (4) Suppression of TNFα-induced NLRP3 mRNA by AgNPs in NCI-H292 cells. Cells were exposed to 20 ng/ml of TNFα and 10 and 100 µg/ml of AgNPs separately and together for 8 h. Expressions of mRNAs were measured using real-time (RT) PCR. The results are figured as means ± SD, n ≥ 3, for each group; ## and **, P < 0.01. #, significant difference compared to the control group. **, significant difference compared to the TNFα-exposed group.