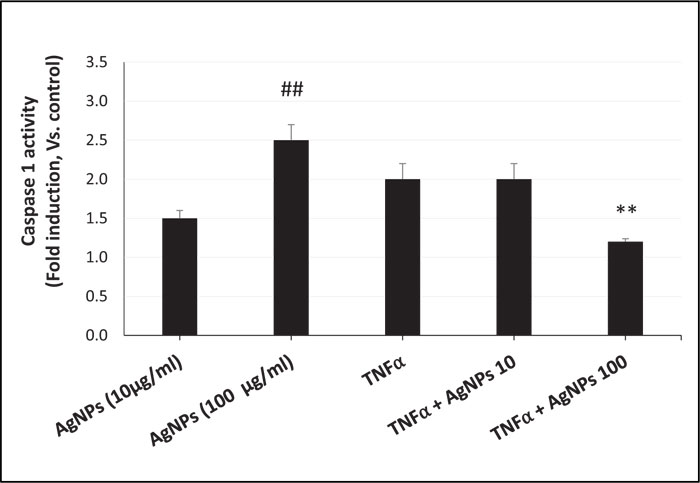
Fig. (5) Suppression of TNFα-induced caspase-1 activity by AgNPs in NCI-H292 cells. Cells were exposed to 20 ng/ml of TNFα and 10 and 100 µg/ml of AgNPs separately and together for 8 h. Caspase-1 activity in cell lysates was then measured using a caspase-1 fluorometric assay. The results are figured as means ± SD, n ≥ 3, for each group; ## and **, P < 0.01. #, significant difference compared to the control group. **, significant difference compared to the TNFα-exposed group.