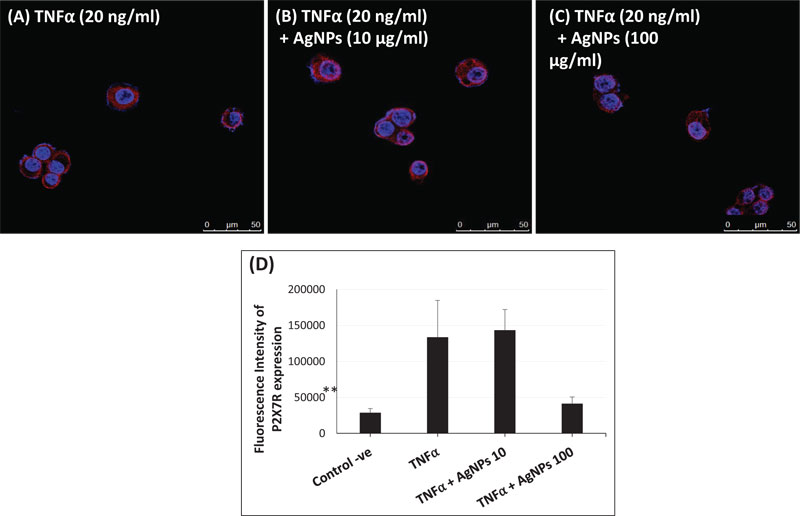
Fig. (6) Expression and localization of Purinergic 2X7 receptor (P2X7R) in NCI-H292 cells using confocal microscopy. Blue indicates the nucleus and red indicates the receptors (P2X7R). (A) NCI-H292 cells were exposed to TNFα (20 ng/ml), showing high expression of P2X7R. (B) NCI-H292 cells were exposed to both TNFα (20 ng/ml) and AgNPs (10 µg/ml), showing high expression of P2X7R. (C) NCI-H292 cells were exposed to both TNFα (20 ng/ml) and AgNPs (100 µg/ml), showing lower expression of P2X7R. Exposure was 12 h for all. Scale bar is 50 µm for all panels. (D) Quantification of P2X7R was determined by the fluorescence intensity. The results are shown as means ± SD, n ≥ 3 for each group. **, P < 0.01, representing a significant difference compared to the TNFα-exposed group.