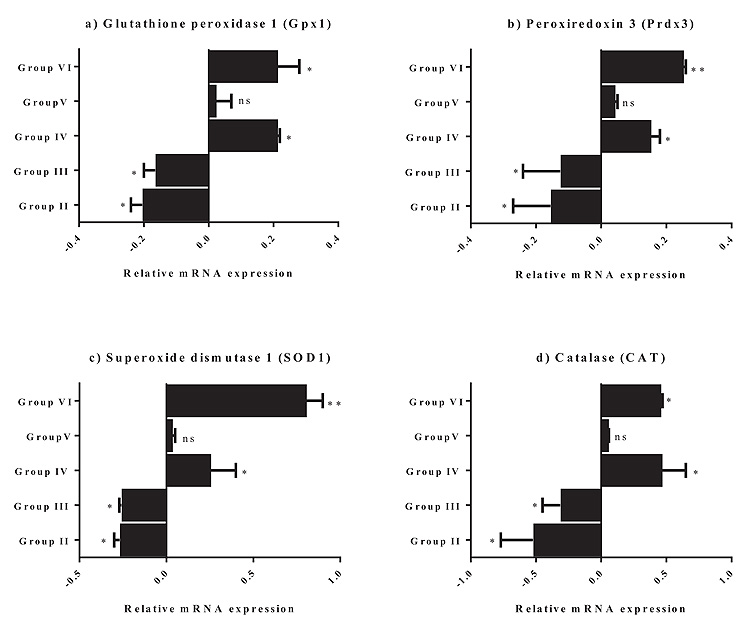
Fig. (1)
mRNA expression levels in mouse brain tissues after different treatments, as detected by sq-PCR. a) Gpx1. b) Prdx3. c) SOD1. d) CAT. Group I received physiological saline solution; Group II was treated with 25 mg/kg of acrylamide; Group III was first treated with acrylamide solution for 10 days, followed by grape seed solution for an additional 10 days; Group IV was treated with grape seed solution for 10 days, followed by acrylamide solution for a subsequent 10 days; Group V was treated with acrylamide solution and grape seed solution simultaneously for 20 days; Group VI was treated with grape seed solution for 20 days. One-way ANOVA was used for data analysis. Values are presented as mean ± SD (n = 10/group). The differences were considered statistically significant at P < 0.05. *P < 0.05, and **P < 0.01.