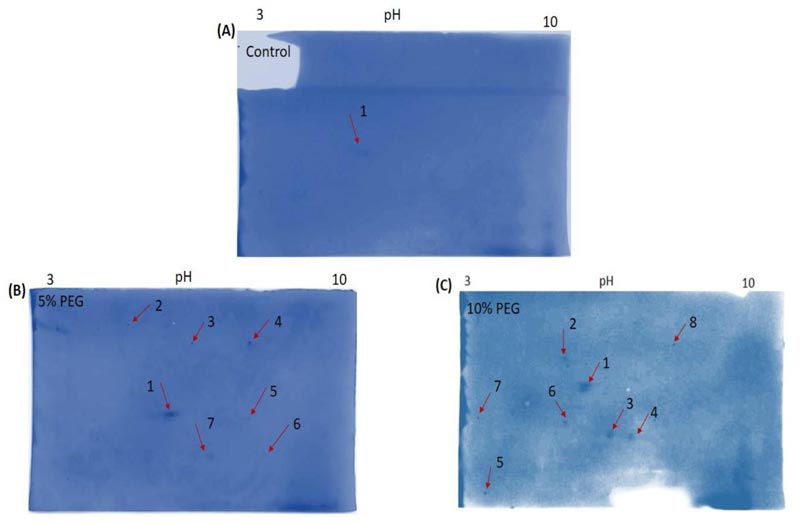
Fig. (3)
Leaf proteome profiles of Zea mays under osmotic-stress. A total of 200 μg total soluble protein were loaded on 7-cm linear IPG strips (pH 3–10 cm) in the first dimension followed by SDS-PAGE (12% (v/v)) analysis. (A) Control (water treatment), (B) Experiment 1, 5% (w/v) PEG treatment and (C) Experiment 2, 10% (w/v) PEG treatment samples for 16 days. The presented results are representative of three independent biological replicates.