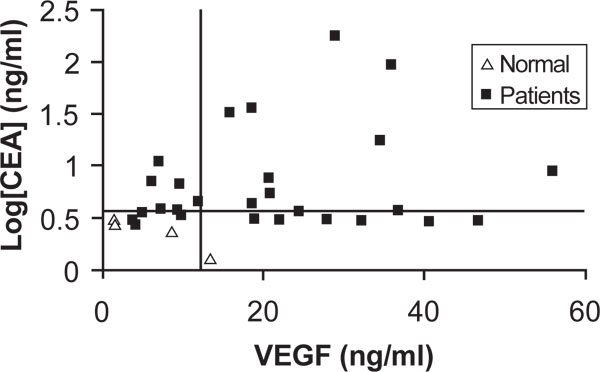
Fig. (1) Patient and normal control distribution depending on both CEA and VEGF levels: The patient distribution, for most patients, is
clearly distinct from the normal samples for both CEA and VEGF. The horizontal line represents the CEA cut-off level at 3.8 ng/ml
(log[CEA] = 0.58), while the vertical line is the VEGF cut-off level of 12.84 ng/ml.