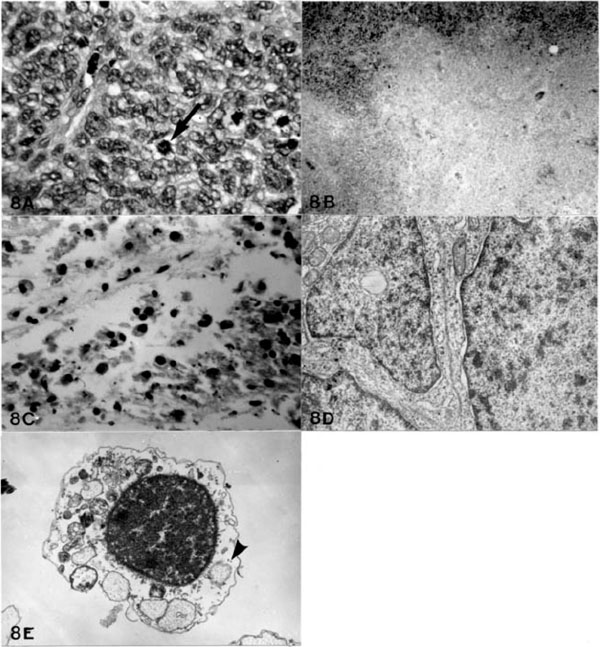
Fig. (8) Photomicrograph of the control tumor at 58 days shows a markedly cellular appearance with frequent mitotic figures (arrow) (A:
H&E, X 960), while the largest infected tumor at the same period shows necrosis (B: H&E, X 375) and frequent microcystic changes with
proliferation of macrophages (C: H&E, X 960). Ultrastructure of the control tumor at 58 days displays compactly arranged cells with large
nuclei with a small amount of cytoplasm (D: X 16,000). The largest infected tumor at the same period reveals severe degeneration with a loss
of the ribosomes (arrowhead) and marked alterations of the subcellular organelles (E: X 22,000).