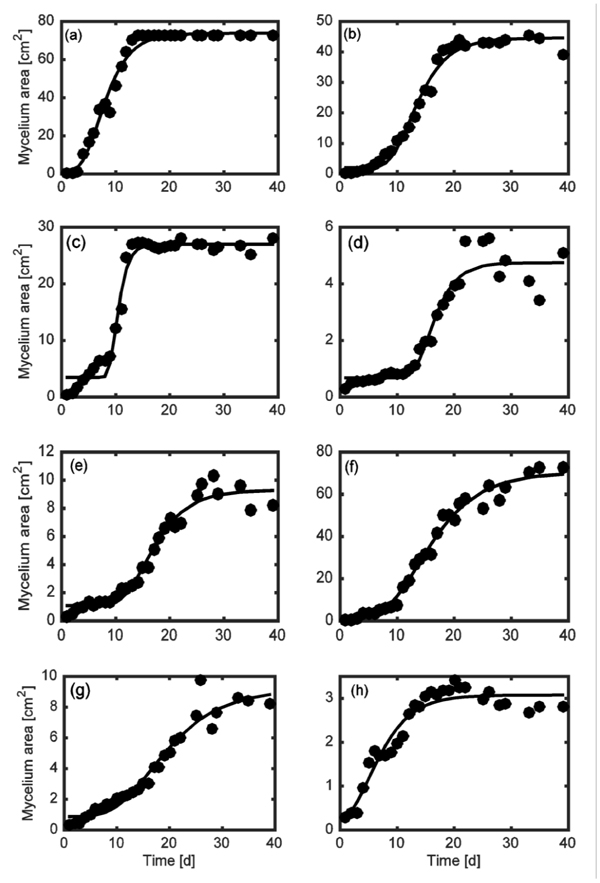
Fig. (2)
Comparison between experimental data (black circle) and model prediction (black line) for the control (a) and for the following conditions (Table
2
): (b) Run 2; (c) Run 3; (d) Run 8; (e) Run 9; (f) Run 11; (g) Run 13; (h) Run 16.