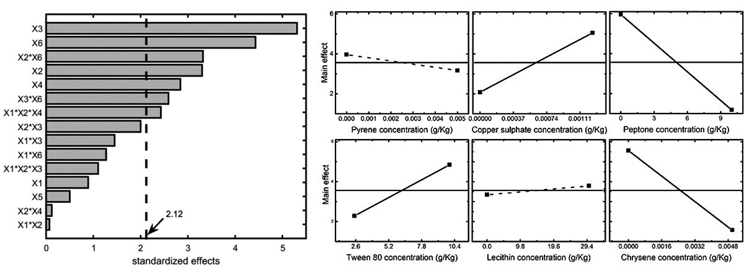
Fig. (3)
Left panel: Pareto chart of standardized effects for the µ parameter (significance threshold – alpha=0.05). Right panel: Main effects on the specific growth rate µ. Significant effects are reported with solid line, not significant effects with dashed line.