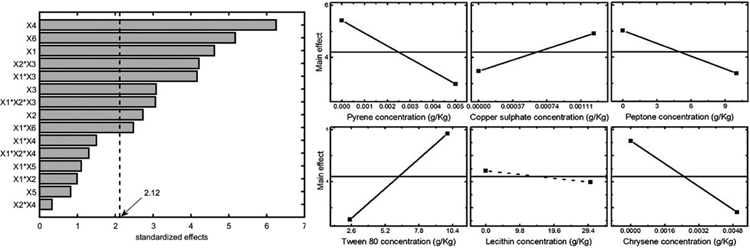
Fig. (5)
Left panel: Pareto chart for the mycelium area at 10 d (significance threshold – alpha=0.05). Right panel: Main effects on the mycelium area at 10 d. Significant effects are reported with solid line, not significant effects with dashed line.