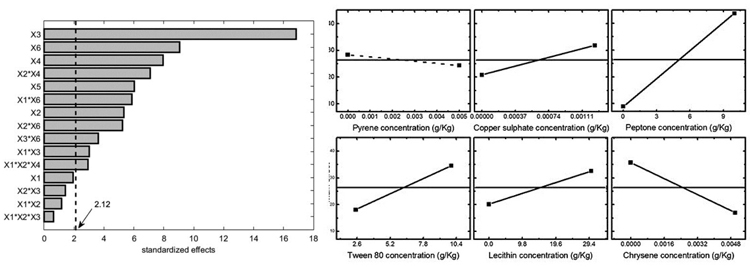
Fig. (6)
Left panel: Pareto chart for maximum area (significance threshold – alpha=0.05). Right panel: main effect for the maximum area. Significant effects are reported with solid line, not significant effects with dashed line.