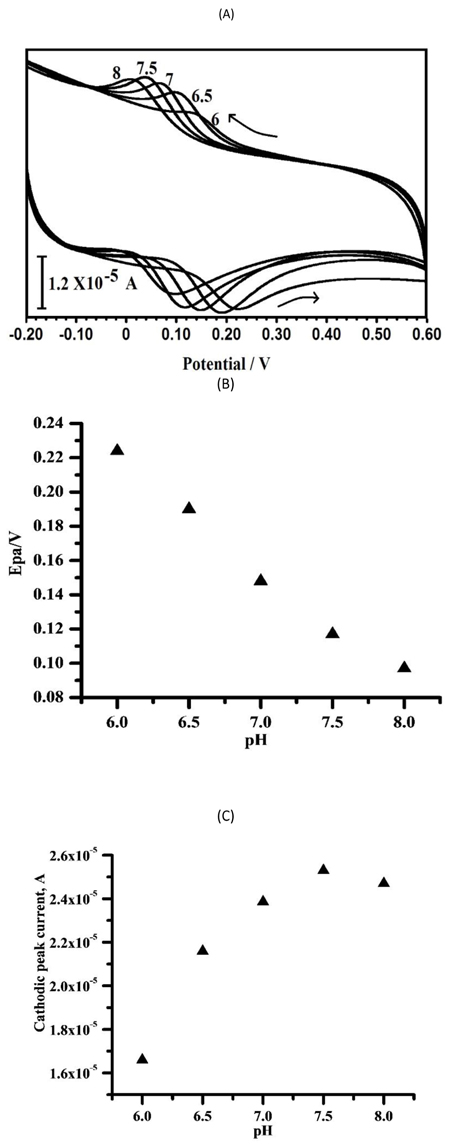
Fig. (7) (a) Cyclic voltammograms obtained at the PPMGPE in 0.1 M PBS in pH values, (a) 5.5 (b) 6 (c) 6.5 (d) 7 (e) 7.5 (f) 8 containing CC (1×10⁻⁴ M) (b) Plot of anodic peak Potential vs. pH (5.5–8.0) of CC (1×10⁻⁴ M) at the PPMGPE (c). Plot of Ipc vs pH for CC.