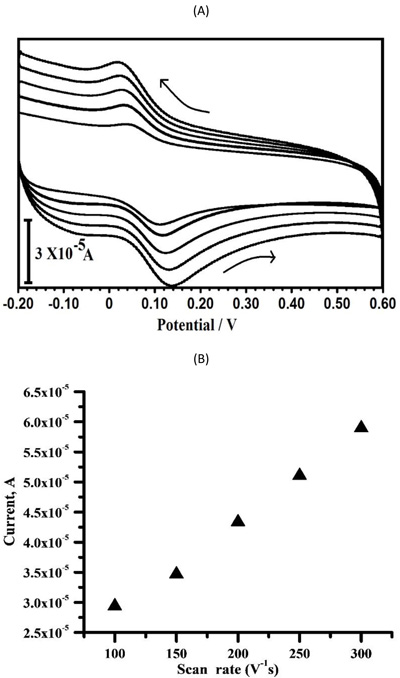
Fig. (8)
(
a
) Cyclic voltammograms of CC (1×10
-4
M) at the PPMGPE in pH 7.5 PBS at various scan rates. From: 100,150, 200, 250 and 300 mV/s. (
b
) Plot of the peak current of CC as a function of the scan rate.