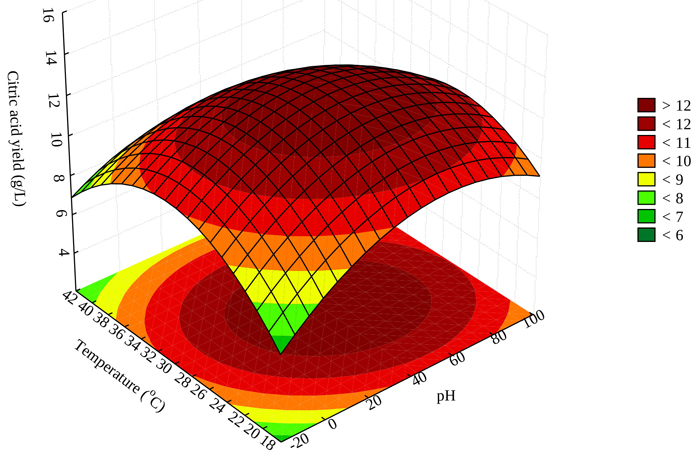
Fig. (3)
Response surface and contour plot showing the effect of Temperature and pH on citric acid yield.