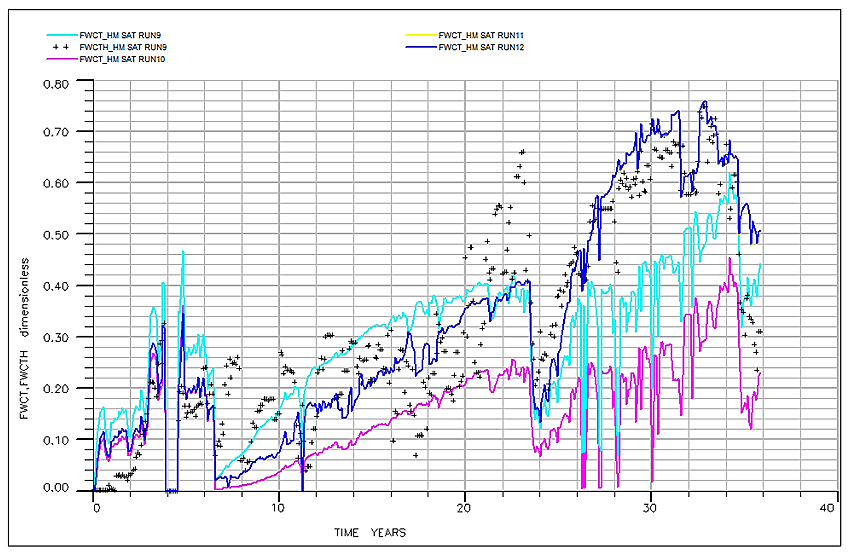
Fig. (13)
Dynamic simulated model for saturation match constrained to field water cut (FWCT). The pink, cyan, deep blue curves represent model responses for observed/historical data indicated by black dots.