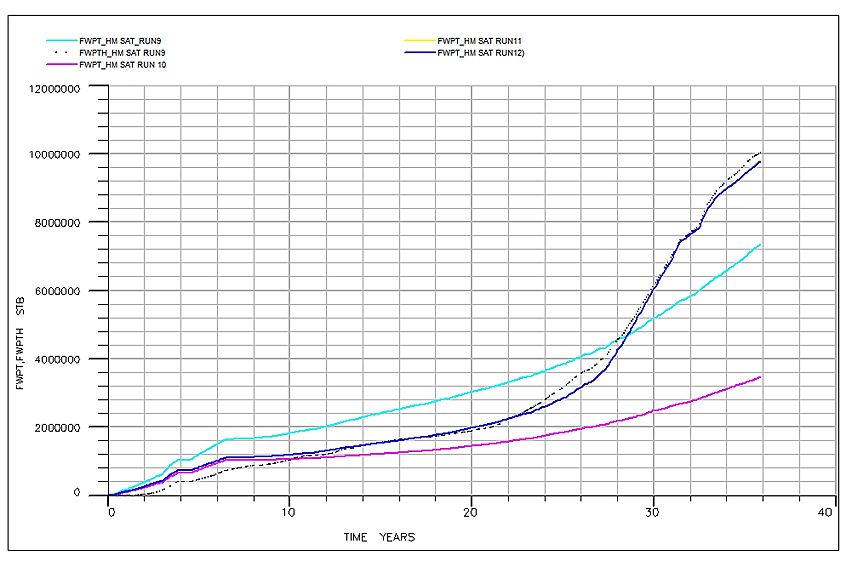
Fig. (14)
Dynamic simulated model for cumulative water production (FWPT) match. The pink, cyan, deep blue curves represent model responses for observed/historical data indicated by black dotted curve.