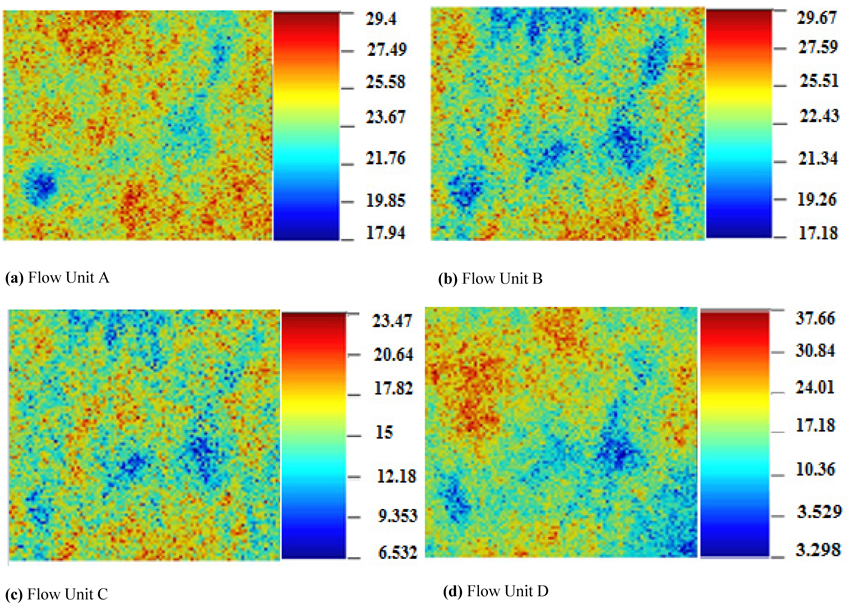
Fig. (9)
2D maps from sequential gaussian simulation showing the porosity distribution for flow units of reservoir X and porosity variations observed for delineated zones across the grid cells are indicated by different colours.