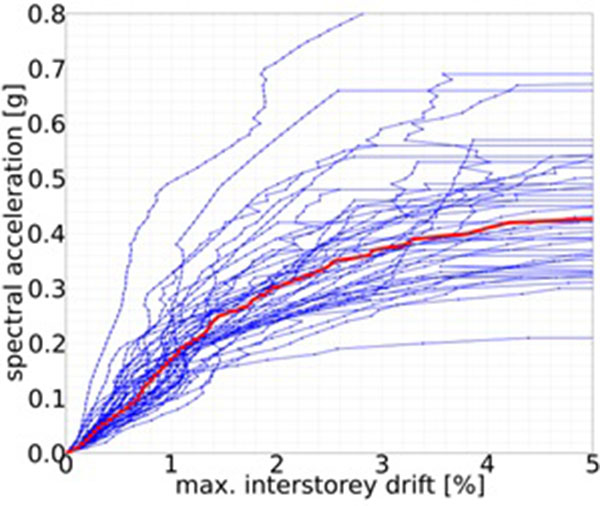
Fig. (3)
Typical Incremental Dynamic Analysis result: each curve represents the maximum interstory drift in the structure from a specific ground motion scaled to several increasing spectral intensity levels [8].