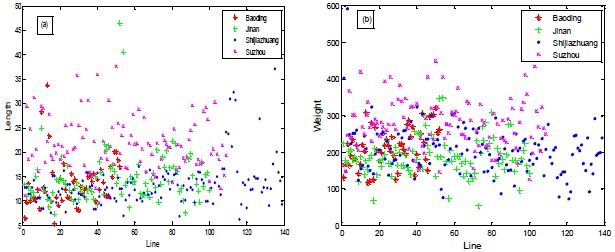
Fig. (3)
Scatter plots: (
a
) between line and length, (
b
) between line and line weight.