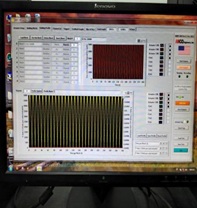
Fig. (10)
Single point excitation curve.