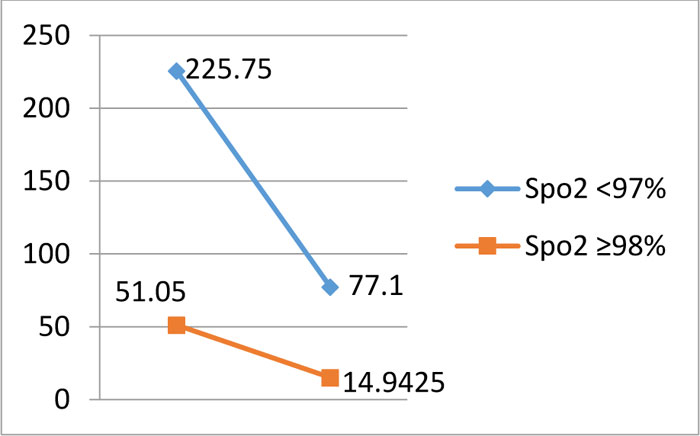
Graph (2)
Line graph illustrating the pattern of reduction of tumor between the two groups.