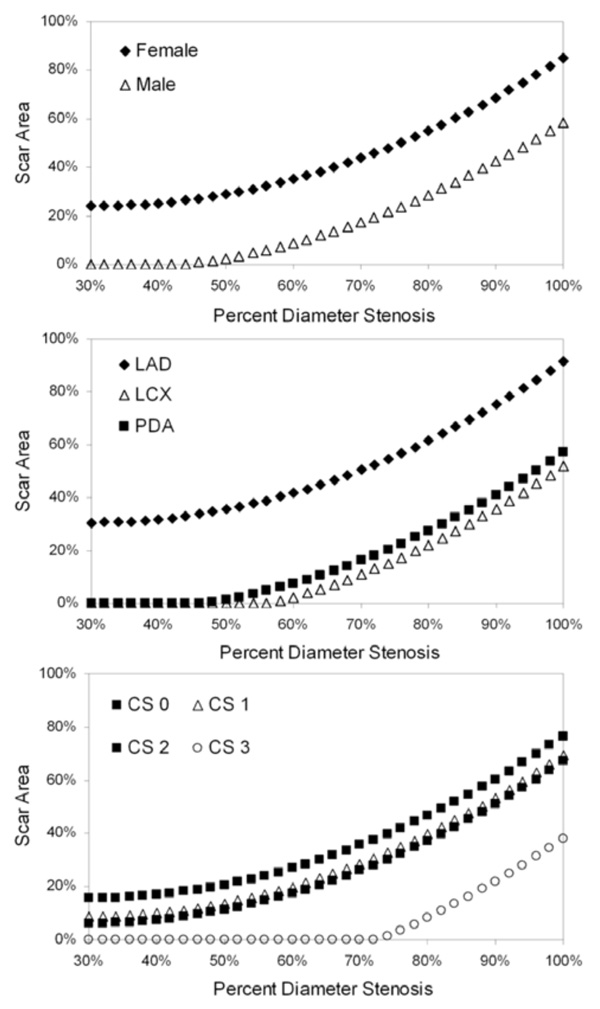
Fig. (3) Model-predicted scar area as a function of percent diameter stenosis. Each graph depicts a separate statistically significant predictor of variability in the scar area linear mixed-model (see text for details): gender, vessel containing the index lesion and collateral score (CS).