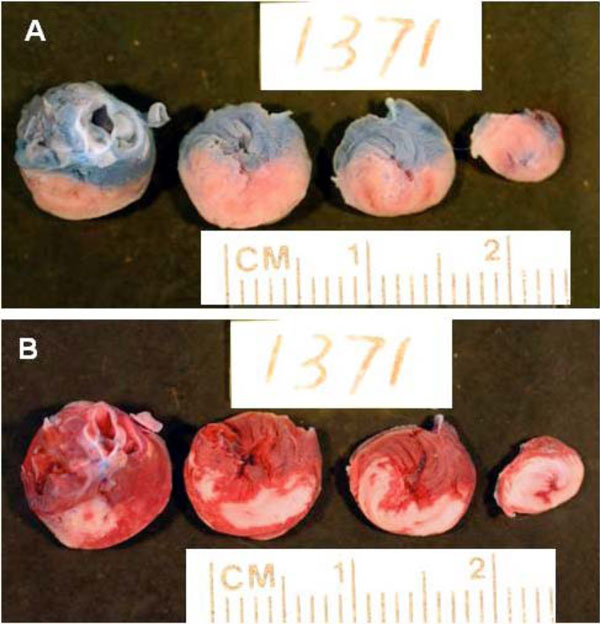
Fig. (1) Representative slices of heart from a rat in control group to show risk and necrosis area. A: Slices show the risk area. The area stained by blue dye represents the nonischemic area. The non-blue area (pink) is the ischemic risk zone. B: The same slices as in panel A stained for TTC. Brick red represents viable myocardial tissue and the white area is the necrotic tissue. Note the large homogeneous infarction (white area) of control ischemic myocardium.