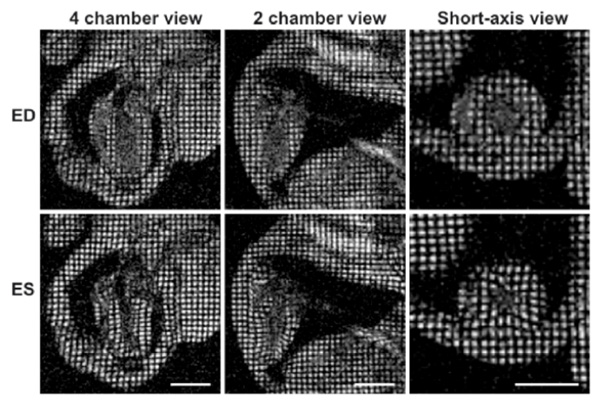
Fig. (3) Myocardial tagging in the mouse. Four chamber, two chamber and short-axis views of a mouse heart at end diastole are shown in the top row, while end systolic frames are depicted in the lower row. The movement of the tagged myocardial tissue can be tracked to calculate myocardial strain. The scale bar represents 5 mm.