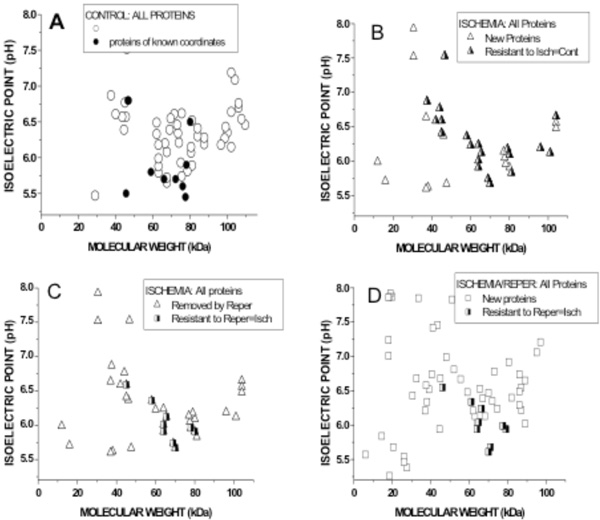
Fig. (4) Graphical representation of Molecular weights (abscissae) and Isoelectric pH (ordinates) of biotin-labled VELM proteins. Control coroanry VELM proteins (A), ischemia VELM proteins (B and C) and ischemia/reperfusion VELM proteins (D). Comparison between A and B: (A) all points (circles and half filled triangles, 58 protein-points) show the proteins identified in control. Dots are proteins whose coordinates (MW, pHi) are known and correspond to: α1, β1, AT1, PRL, B2, βEnaC, PECAM-1, VCAM-1, and ICAM-1. (B). All points (triangles and half filled triangles) show the proteins identified in ischemia. Half filled triangles are 20 protein-points that were not affected by the transition from control to ischemia. None of the dots in A appear in B. Comparison between C (=B) and D: (C) all points (Triangles and half filled squares show all the proteins identified in ischemia. Triangle points are proteins that do not appear during ischemia/reperfusion in D. (D) all points (squares and halffilled squares) show the proteins identified in ischemia/reperfusion. Half filled squares are 9 protein-points that were not affected by the transition from ischemia to ischemia/reperfusion. Of these 9 protein-points, 7 also appear in control A, i. e. are proteins resistant to ischemia and I/R.