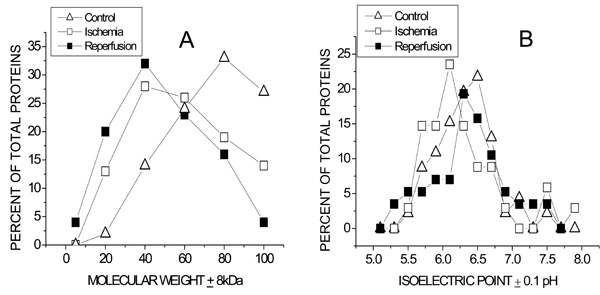
Fig. (5) Population distributions of Molecular weight (A) and isoelectric pH (B) of coronary VELM proteins during control, ischemia and ischemia/reperfusion. (A).The greatest number of proteins for control was 80kD, for ischemia and ischemia/reperfusion the peaks were at 40kD. The control curve for MW > 60kD lies above that for ischemia and even lower is the ischemia/reperfusion curve. In contrast, the control curve for MW < 60kD lies below that for ischemia and even lower than the ischemia/reperfusion curve. (B). The control, ischemia and ischemia/reperfusion pHi curves also differ. The greatest number of proteins for control have a pI = 6.40, for ischemia and ischemia/reperfusion the corresponding peaks were at pI = 6.0 and pI = 6.2 respectively.