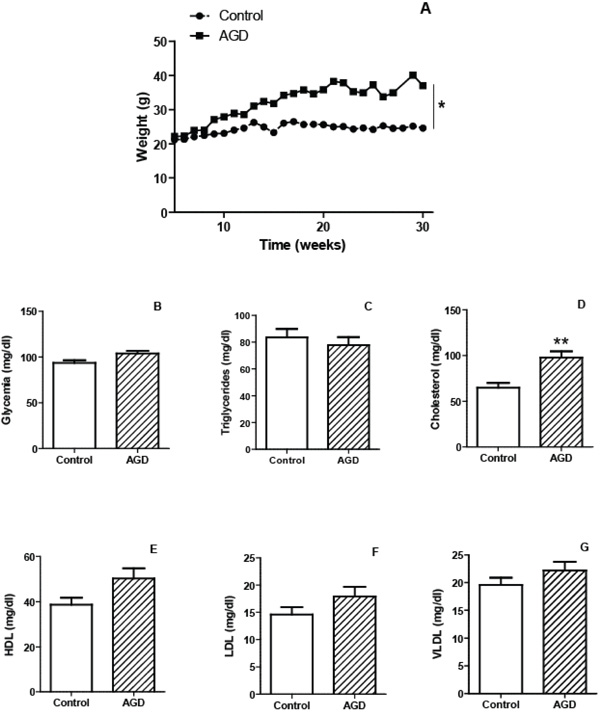
Fig. (1) Characteristics of mice submitted to the atherogenic diet. The mean weights of n=30 control (circles) or 30 atherogenic diet-fed
(AGD mice, squares) mice recorded at different weeks are depicted (panel A). Plasma levels of glycemia (panel B) and lipid profile: triglycerides
(panel C) cholesterol (panel D), HDL (panel E), LDL (panel F) and VLDL (panel G) were determined for control and AGD mice.
Results shown are the mean ± SEM of n = 30 mice from each group. Differs significantly from control animals, * p<0.05, ** p<0.01.