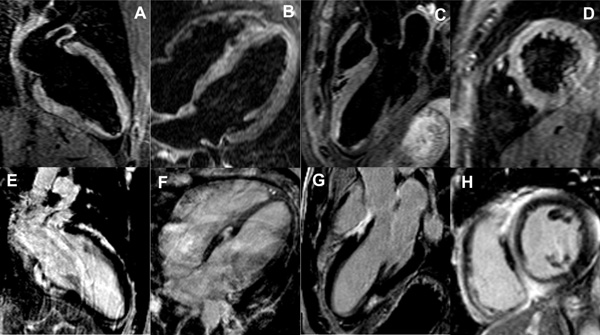
Fig. (1)
Normal T2 imaging (A-D) and extensive mid myocardial wall late gadolinium enhancement (E-H) in the long and short axis views.