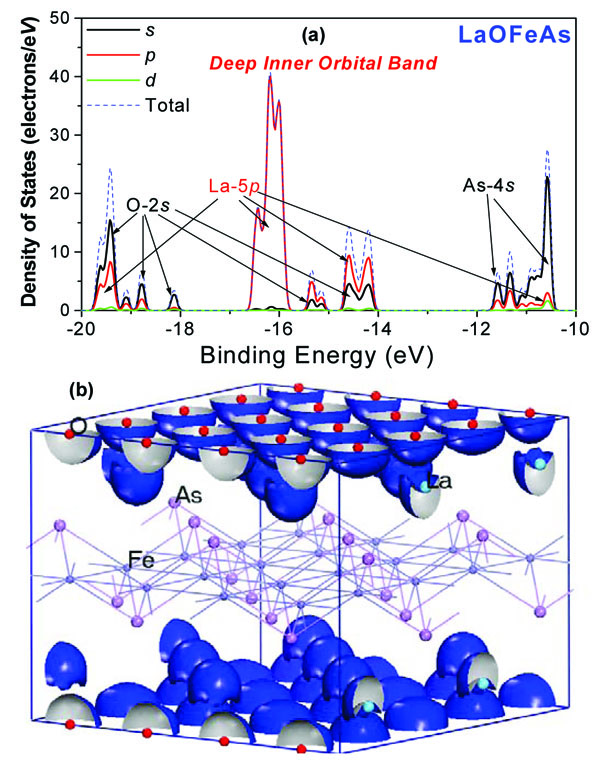
Fig. (5) (a) the DOS peaks of deep inner orbitals in the range of -20 to -10eV for LaOFeAs model; (a) the contour map of electronic density
distribution for one inner orbital O-2s corresponding to the DOS peak at -19.5eV, isosurfaces correspond to 0.030e/Å3. Both two figures
indicate the intensive inner-orbital coupling between O-2s and La-5p.