Fig. (6)
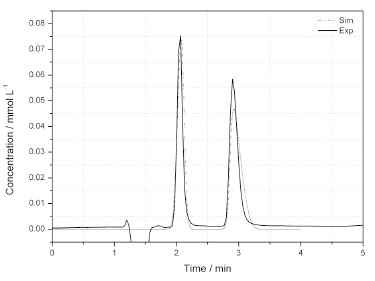
Comparison between experimental (solid lines) and simulated (dash lines) concentraion profiles for D,L-Tyr (1.8 mmol L
-1
).