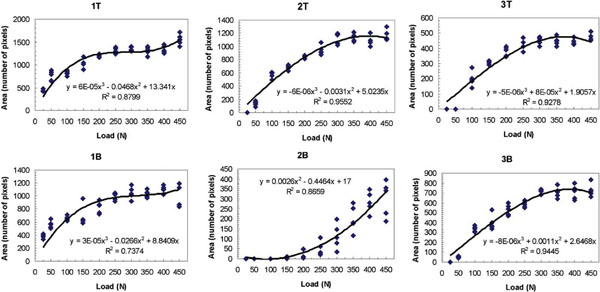
Fig. (6)
Mark area
vs
. specified maximum load curves – upper (T) and lower (B) contacts #s 1–3.