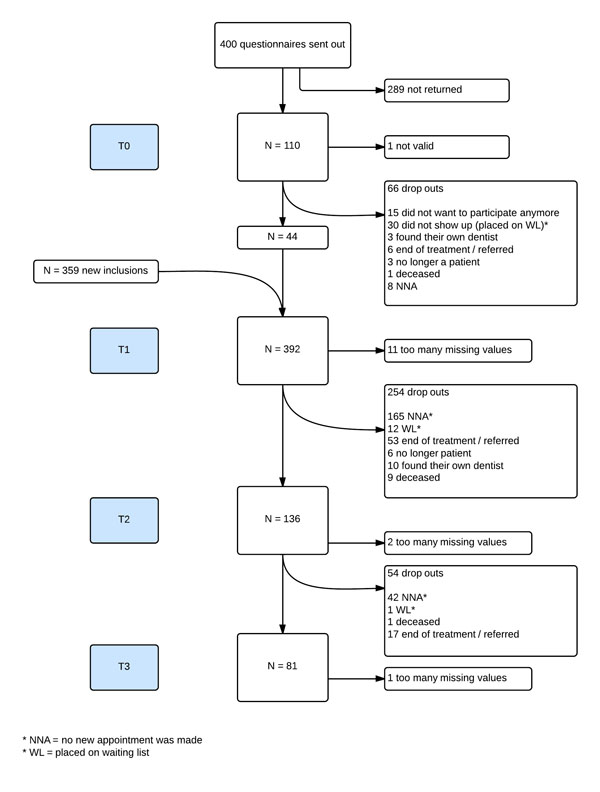
Fig. (1)
Flowchart of participants across T0 through T3.