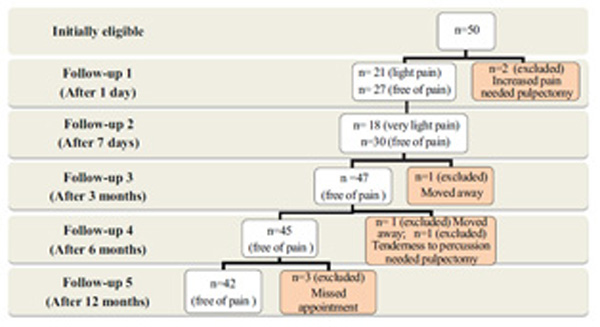
Fig. (1)
Flow diagram of study participants and distributions of post operative pain intensity during follow up appointments.