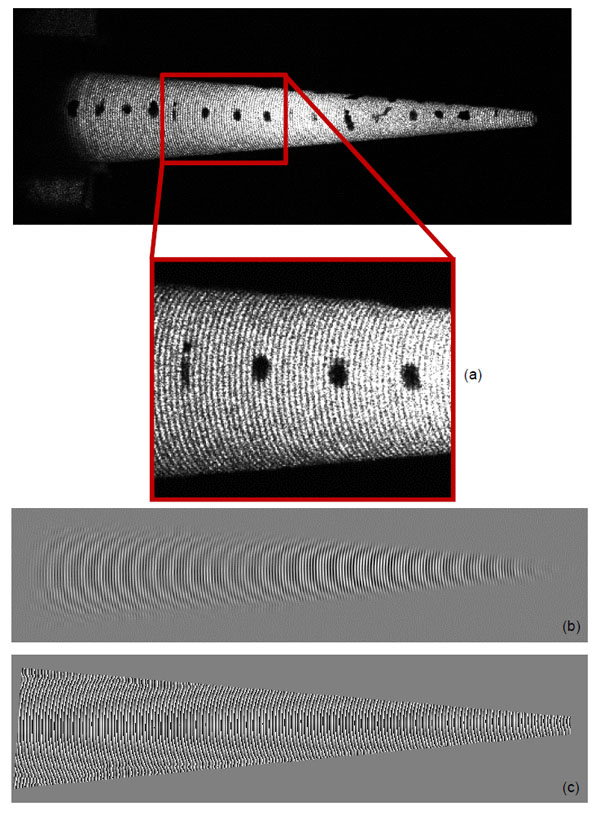
Fig. (2)
(
a
) Lines projected onto the sample surface. (
b
) Pattern of the projected lines after the filtering process. (
c
) Phase of the specimen @
T
env
=18°C (environment temperature).