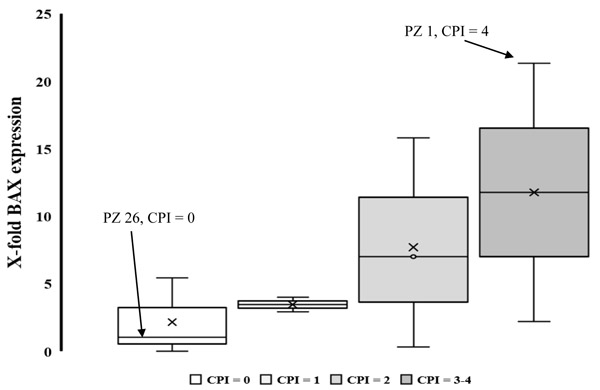
Fig. (2)
BCL2 Associated X (BAX) gene expression pattern in 29 subjects ordered by periodontal status (CPI from 0 to 4). Horizontal line - represents the median, while X = media values for each group. The patient with the worst clinical parameters (CPI = 4) showed the highest BAX expression value.