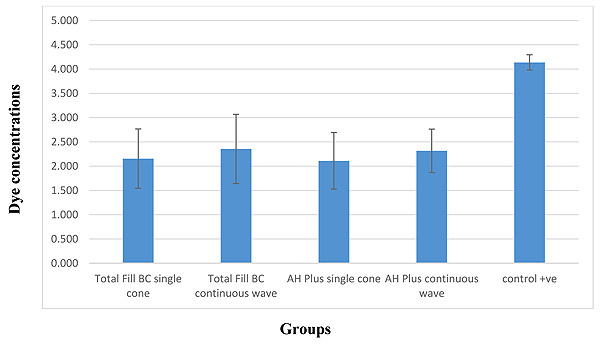
Fig. (1)
Bar chart shows dye concentration µg/ml for all study groups.