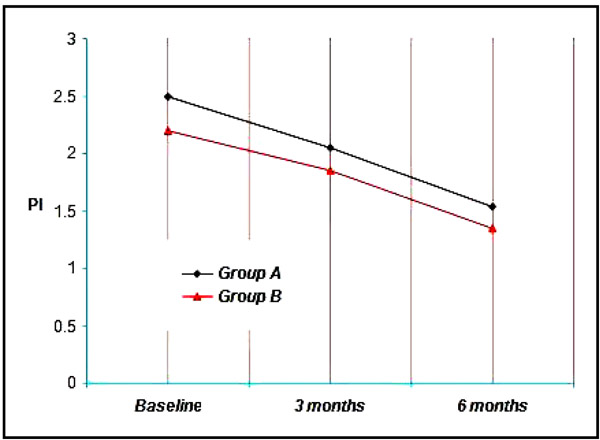
Graph. (1)
Showing the mean plaque index among the study groups at various time intervals.