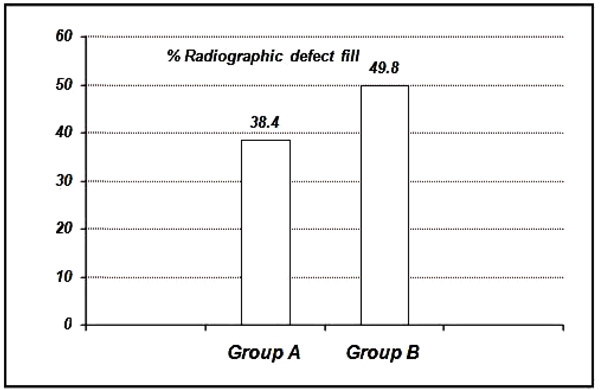
Graph. (10)
Showing the mean percentage of radiographic defect fill among the study groups at six months.