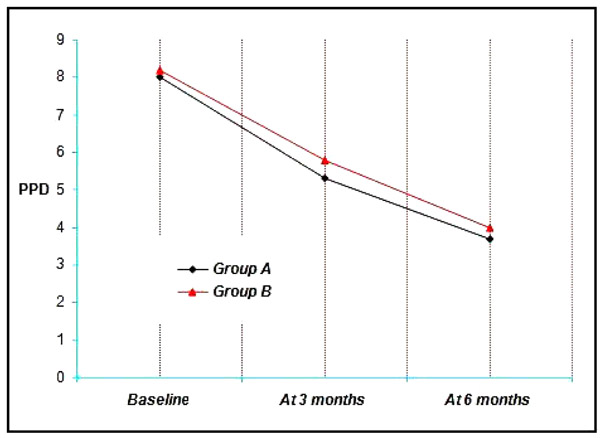
Graph. (4)
Showing the mean probing pocket depth among the study groups at various time intervals.