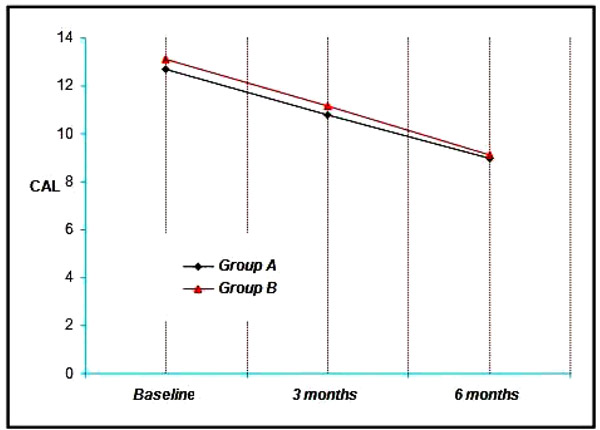
Graph. (5)
Showing the mean clinical attachment level among the study groups at various time intervals.