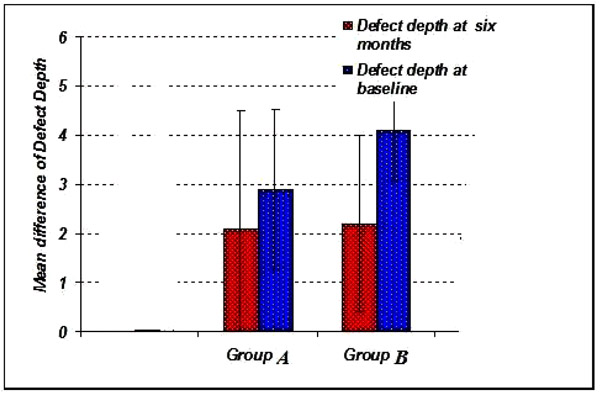
Graph. (8)
Showing the mean radiographic difference in defect depth among the study groups.